Mostrando entradas con la etiqueta información. Mostrar todas las entradas

sábado, 10 de mayo de 2014

Vuelven los cassettes gracias a una nueva tecnología

Sony desarrolló una nueva generación de cintas magnéticas destinadas al almacenamiento de datos.

REGRESO. La vuelta de un viejo conocido.

Sony desarrolló una nueva generación de cintas magnéticas capaces de guardar hasta 185 terabytes sin aumentar el tamaño del cassette.

El truco es que esta nueva cinta magnética es 74 veces más densa que las anteriores, y cuenta con una capa de “nano.cristales” que utiliza espacios de memoria de solamente 7.7 nanómetros. Esto quiere decir que es capaz de guardar más información en el mismo espacio.

La empresa japonesa e IBM ofrecieron detalles de esta tecnología en la convención Intermag Europe 2014 que se llevó a cabo en Alemania. Presentaron un método de almacenamiento de datos en cintas magnéticas que son capaces de almacenar 148 GB por pulgada, registrando hasta 185 TB de información por unidad.

Las cintas de almacenamiento de datos de Sony son una versión actualizada y mejorada de un modelo anterior desarrollado por IBM y FujiFilm que podía guardar hasta 35 TB de datos.

Para conseguir este logro, Sony ha utilizado y mejorado la tecnología conocida como “deposición catódica”, misma que consiste en envolver la cinta en una capa de cristales magnéticos que utilizan espacios de memoria de solamente 7.7 nanómetros.


A pesar de que para el gran público los cassettes están en desuso, las cintas de alta densidad son utilizadas por empresas y agencias gubernamentales para guardar información de archivo, ya que son muy baratos, gastan poca energía y son más fiables que el almacenamiento basado en disco.

Con este avance, los discos de vinilo no serán los únicos que tendrán una segunda oportunidad en el mercado.

ORIGINAL: TN.com.ar
5 de Mayo de 2014

lunes, 17 de marzo de 2014

The 17 Equations That Changed The Course Of History

Mathematics is all around us, and it has shaped our understanding of the world in countless ways.

In 2013, mathematician and science author Ian Stewart published a book on 17 Equations That Changed The World. We recently came across this convenient table on Dr. Paul Coxon’s twitter account by mathematics tutor and blogger Larry Phillips that summarizes the equations. (Our explanation of each is below):
 Stewart 17 equations table
Here is a little bit more about these wonderful equations that have shaped mathematics and human history:
Pythagorean theorem chalkboard
1) The Pythagorean Theorem: This theorem is foundational to our understanding of geometry. It describes the relationship between the sides of a right triangle on a flat plane: square the lengths of the short sides, a and b, add those together, and you get the square of the length of the long side, c.
This relationship, in some ways, actually distinguishes our normal, flat, Euclidean geometry from curved, non-Euclidean geometry. For example, a right triangle drawn on the surface of a sphere need not follow the Pythagorean theorem.

2) Logarithms: Logarithms are the inverses, or opposites, of exponential functions. A logarithm for a particular base tells you what power you need to raise that base to to get a number. For example, the base 10 logarithm of 1 is log(1) = 0, since 1 = 100; log(10) = 1, since 10 = 101; and log(100) = 2, since 100 = 102.
The equation in the graphic, log(ab) = log(a) + log(b), shows one of the most useful applications of logarithms: they turn multiplication into addition.
Until the development of the digital computer, this was the most common way to quickly multiply together large numbers, greatly speeding up calculations in physics, astronomy, and engineering.

3) Calculus: The formula given here is the definition of the derivative in calculus. The derivative measures the rate at which a quantity is changing. For example, we can think of velocity, or speed, as being the derivative of position — if you are walking at 3 miles per hour, then every hour, you have changed your position by 3 miles.
Naturally, much of science is interested in understanding how things change, and the derivative and the integral — the other foundation of calculus — sit at the heart of how mathematicians and scientists understand change.
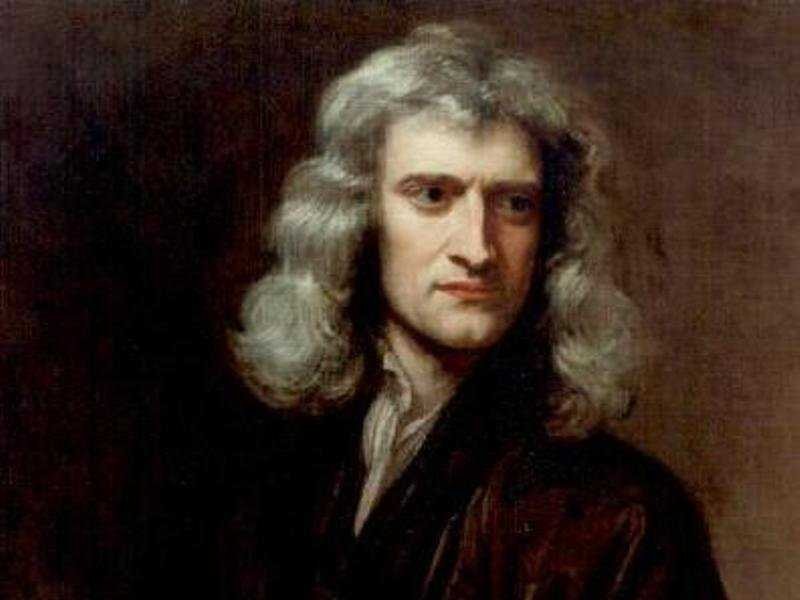
 Isaac Newton
Isaac Newton
4) Law of Gravity: Newton’s law of gravitation describes the force of gravity between two objects, F, in terms of a universal constant, G, the masses of the two objects, m1 and m2, and the distance between the objects, r. Newton’s law is a remarkable piece of scientific history — it explains, almost perfectly, why the planets move in the way they do. Also remarkable is its universal nature — this is not just how gravity works on Earth, or in our solar system, but anywhere in the universe.
Newton’s gravity held up very well for two hundred years, and it was not until Einstein’s theory of general relativity that it would be replaced.

5) The square root of -1: Mathematicians have always been expanding the idea of what numbers actually are, going from natural numbers, to negative numbers, to fractions, to the real numbers. The square root of -1, usually written i, completes this process, giving rise to the complex numbers.
Mathematically, the complex numbers are supremely elegant. Algebra works perfectly the way we want it to — any equation has a complex number solution, a situation that is not true for the real numbers : x2 + 4 = 0 has no real number solution, but it does have a complex solution: the square root of -2. Calculus can be extended to the complex numbers, and by doing so, we find some amazing symmetries and properties of these numbers. Those properties make the complex numbers essential in electronics and signal processing.
 CubeA cube.
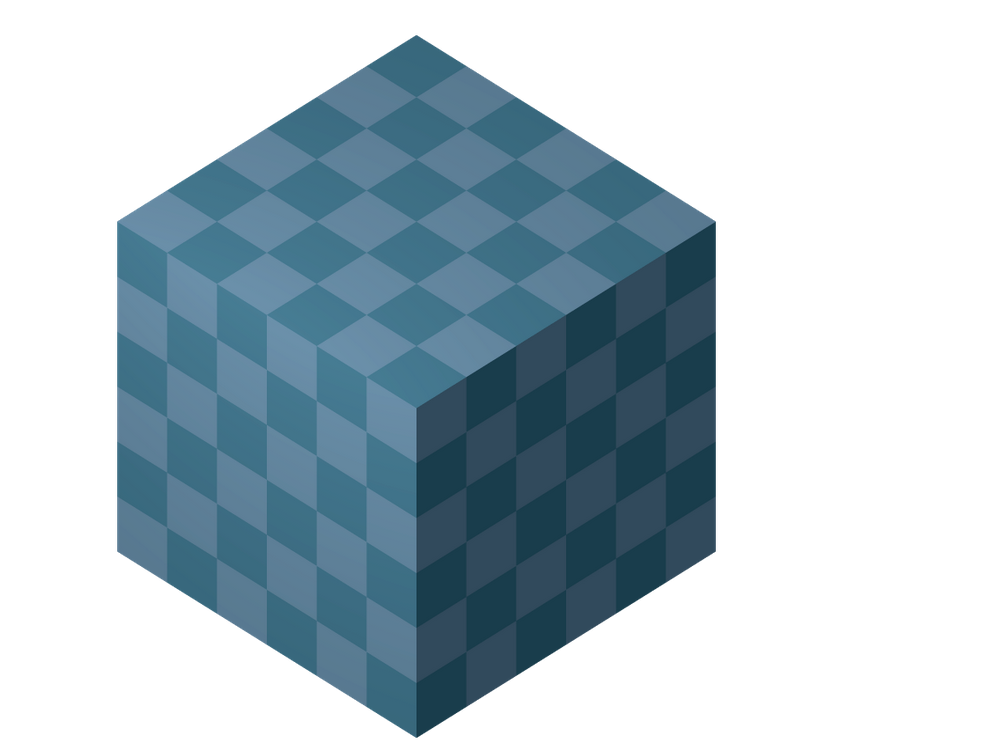
6) Euler’s Polyhedra Formula: Polyhedra are the three-dimensional versions of polygons, like the cube to the right. The corners of a polyhedron are called its vertices, the lines connecting the vertices are its edges, and the polygons covering it are its faces.
A cube has 8 vertices, 12 edges, and 6 faces. If I add the vertices and faces together, and subtract the edges, I get 8 + 6 – 12 = 2.

Euler’s formula states that, as long as your polyhedron is somewhat well behaved, if you add the vertices and faces together, and subtract the edges, you will always get 2. This will be true whether your polyhedron has 4, 8, 12, 20, or any number of faces.
Euler’s observation was one of the first examples of what is now called a topological invariant — some number or property shared by a class of shapes that are similar to each other. The entire class of “well-behaved” polyhedra will have V + F – E = 2. This observation, along with with Euler’s solution to the Bridges of Konigsburg problem, paved the way to the development of topology, a branch of maths essential to modern physics.
 Bell curve
The normal distribution.
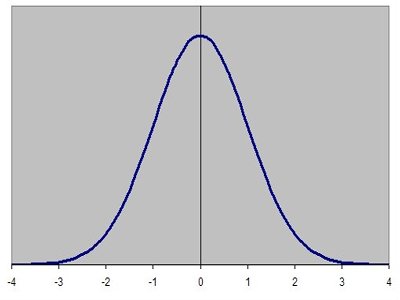
7) Normal distribution: The normal probability distribution, which has the familiar bell curve graph to the left, is ubiquitous in statistics.
The normal curve is used in physics, biology, and the social sciences to model various properties. One of the reasons the normal curve shows up so often is that it describes the behaviour of large groups of independent processes.

8) Wave Equation: This is a differential equation, or an equation that describes how a property is changing through time in terms of that property’s derivative, as above. The wave equation describes the behaviour of waves — a vibrating guitar string, ripples in a pond after a stone is thrown, or light coming out of an incandescent bulb. The wave equation was an early differential equation, and the techniques developed to solve the equation opened the door to understanding other differential equations as well.

9) Fourier Transform: The Fourier transform is essential to understanding more complex wave structures, like human speech. Given a complicated, messy wave function like a recording of a person talking, the Fourier transform allows us to break the messy function into a combination of a number of simple waves, greatly simplifying analysis.

The Fourier transform is at the heart of modern signal processing and analysis, and data compression.

10) Navier-Stokes Equations: Like the wave equation, this is a differential equation. The Navier-Stokes equations describes the behaviour of flowing fluids — water moving through a pipe, air flow over an aeroplane wing, or smoke rising from a cigarette. While we have approximate solutions of the Navier-Stokes equations that allow computers to simulate fluid motion fairly well, it is still an open question (with a million dollar prize) whether it is possible to construct mathematically exact solutions to the equations.

11) Maxwell’s Equations: This set of four differential equations describes the behaviour of and relationship between electricity (E) and magnetism (H).

Maxwell’s equations are to classical electromagnetism as Newton’s laws of motion and law of universal gravitation are to classical mechanics — they are the foundation of our explanation of how electromagnetism works on a day to day scale. As we will see, however, modern physics relies on a quantum mechanical explanation of electromagnetismand it is now clear that these elegant equations are just an approximation that works well on human scales.

12) Second Law of Thermodynamics: This states that, in a closed system, entropy (S) is always steady or increasing. Thermodynamic entropy is, roughly speaking, a measure of how disordered a system is. A system that starts out in an ordered, uneven state — say, a hot region next to a cold region — will always tend to even out, with heat flowing from the hot area to the cold area until evenly distributed.

The second law of thermodynamics is one of the few cases in physics where time matters in this way. Most physical processes are reversible — we can run the equations backwards without messing things up. The second law, however, only runs in this direction. If we put an ice cube in a cup of hot coffee, we always see the ice cube melt, and never see the coffee freeze.

 AP050124019477
Albert Einstein

13) Relativity: Einstein radically altered the course of physics with his theories of special and general relativity. The classic equation E = mc2 states that matter and energy are equivalent to each other. Special relativity brought in ideas like the speed of light being a universal speed limit and the passage of time being different for people moving at different speeds.
General relativity describes gravity as a curving and folding of space and time themselves, and was the first major change to our understanding of gravity since Newton’s law. General relativity is essential to our understanding of the origins, structure, and ultimate fate of the universe.

14) Schrodinger’s Equation: This is the main equation in quantum mechanics. As general relativity explains our universe at its largest scales, this equation governs the behaviour of atoms and subatomic particles.
Modern quantum mechanics and general relativity are the two most successful scientific theories in history — all of the experimental observations we have made to date are entirely consistent with their predictions. Quantum mechanics is also necessary for most modern technology — nuclear power, semiconductor-based computers, and lasers are all built around quantum phenomena.

15) Information Theory: The equation given here is for Shannon information entropy. As with the thermodynamic entropy given above, this is a measure of disorder. In this case, it measures the information content of a message — a book, a JPEG picture sent on the internet, or anything that can be represented symbolically. The Shannon entropy of a message represents a lower bound on how much that message can be compressed without losing some of its content.
Shannon’s entropy measure launched the mathematical study of information, and his results are central to how we communicate over networks today.

16) Chaos Theory: This equation is May’s logistic map. It describes a process evolving through time — xt+1, the level of some quantity x in the next time period — is given by the formula on the right, and it depends on xt, the level of x right now. k is a chosen constant. For certain values of k, the map shows chaotic behaviour: if we start at some particular initial value of x, the process will evolve one way, but if we start at another initial value, even one very very close to the first value, the process will evolve a completely different way.

We see chaotic behaviour — behaviour sensitive to initial conditions — like this in many areas. Weather is a classic example — a small change in atmospheric conditions on one day can lead to completely different weather systems a few days later, most commonly captured in the idea of a butterfly flapping its wings on one continent causing a hurricane on another continent.

17) Black-Scholes Equation: Another differential equation, Black-Scholes describes how finance experts and traders find prices for derivatives. Derivatives — financial products based on some underlying asset, like a stock — are a major part of the modern financial system.
The Black-Scholes equation allows financial professionals to calculate the value of these financial products, based on the properties of the derivative and the underlying asset.
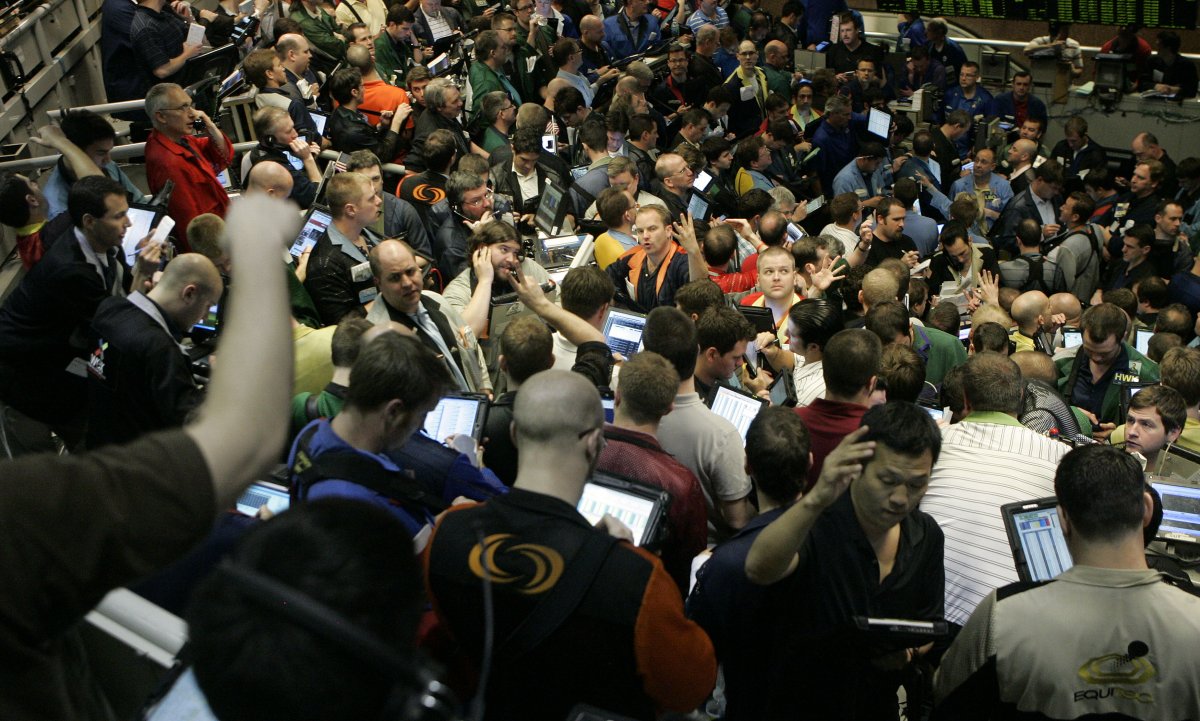
 Cboe stock options traderHere are some traders in the S&P 500 options pit at the Chicago Board Options Exchange. You won’t find a single person here that hasn’t heard about the Black-Scholes equation.


ORIGINAL: Business Insider
Andy Kiersz
Mar 13 2014

lunes, 3 de marzo de 2014

El mapa que explica la deforestación en el mundo (y lo hace en tiempo real)

Varios organismos lanzan Global Forest Watch, una web que integra capas de datos para ver el estado de los bosques de todo el mundo

Los mapas los pone Google; las imágenes de satélite, la NASA; los datos, el World Resources Institute y otras agencias; y la capa de visualización, la empresa española Vizzuality

El recurso sirve para gobiernos, empresas, comunidades y para que cualquier ciudadano explore los cambios forestales casi según suceden, porque los datos se actualizan con frecuencia

 Global Forest Watch.


Mira el mapa. El rosa representa la masa forestal que ha desaparecido en España desde el año 2000. ¿Qué pasa en Galicia, que se ha perdido tanta? "Muy fácil: en Galicia se producen el 50% de incendios de España", responde Ángel Dorrio, técnico de Medioambiente de la asociación Amigos da Terra.

Las estadísticas del Ministerio de Agricultura y el mapa de España en Llamas confirman que Galicia es la comunidad en la que más hay. "Como ves, siempre aparece Galicia en rojo. Los datos son graves, llevamos más de cuarenta años con el mismo problema". Un caso reciente es el de las Fragas do Eume. Si hacemos zum, vemos con detalle la zona devastada. La captura de la izquierda es el parque entre 2005 y 2009; la de la derecha, entre 2005 y 2013. En abril de 2012, el incendio extinguió más de 750 hectáreas (que son las que aparecen en rosa).


Ahora mira esta otra imagen:


Es una de las áreas del mundo en la que más árboles desaparecen. Aunque la del Amazonas es la más sonada, lo de arriba es el zum sobre la región de Gran Chaco, entre el sur de Brasil, Argentina y Paraguay. ¿Qué pasa? ¿Por qué la deforestación allí es cuadrada? Se llama sojización y es el cultivo de soja. "En Argentina y Brasil ha crecido brutalmente. Sustituyen cultivos tradicionales por monocultivo y hay mucha deforestación", explica Tom Kucharz, de Ecologistas en Acción.

¿Y por qué soja? Es más barata ("es agricultura intensiva con muchísima tecnología y fertilizantes químicos para matar la mala hierba"), sus proteínas son perfectas para la ganadería industrial (la que usan las cadenas de comida rápida, por ejemplo) y se vende muy bien en los mercados internacionales.

Este gráfico muestra la evolución de su precio, que sólo de 2007 a 2008 subió un 86%. Como Kucharz, ecologistas e investigadores llevan años alertando sobre el problema y sus efectos económicos y sociales. También sobre los medioambientales, claro.

Pintar los cambios de los bosques

Galicia y sus incendios, y el Gran Chaco y su sojización son sólo dos de los casos de deforestación que hay en el mundo. Las imágenes para explicarlos las hemos sacado de Global Forest Watch, un proyecto del World Resources Institute presentado la semana pasada que, en forma de web, muestra el estado de los bosques del mundo.

Los mapas los pone Google; los datos de árboles desaparecidos y aparecidos e imágenes de satélite, organismos como la Universidad de Maryland o la NASA. Y la visualización de esos datos (o cómo ver, en una imagen, que los incendios forestales en Galicia o los cultivos de soja se cargan los bosques), la empresa española Vizzuality y su tecnología CartoDB (que en eldiario.es hemos utilizado, por ejemplo, para ver el tráfico ferroviario en España).

"Lo que nos gusta es contar historias y los mapas son un medio para ello", explica Carlos Matallín, uno de los desarrolladores que ha ‘pintado’ las capas de datos. "Tenemos datos muy ricos, importantes y validados, pero que no puedes tirar en crudo porque no se saca nada en claro. Puedes decir ‘sí, hay deforestación’. La parte bonita, interesante y compleja es cómo muestro estos datos a cualquier persona de forma amigable e intuitiva. Y con ello, contar, por ejemplo, la deforestación en un área protegida y cómo a través de las alertas se puede parar". ¿Alertas?


Si un árbol cae y nadie lo escucha, ¿hace ruido?

Un problema de la deforestación es que cuando se detecta (cuando el árbol cae en mitad del bosque) suele ser tarde para pararla. Por eso la novedad de Global Forest Watch, que lleva dos años en desarrollo y del que ha habido prototipos previos, es el tiempo real: los datos que integra no sólo son de muy buena calidad (aquí explican de dónde proviene cada set de datos y cómo se ha tomado), sino que en muchos casos se actualizan diaria o mensualmente. También la posibilidad de delimitar áreas, guardarlas y poner alertas que te avisen si 'algo' cambia (si algún árbol cae en mitad del bosque).

.

"La página dice: 'near real time' (casi en tiempo real). La capa de fuegos, por ejemplo, se puede tener con hasta un día de diferencia. En cada capa están explicadas la resolución de los datos y la periodicidad con la que se actualizan", cuenta Matallín. Las capas más importantes son las de Forest Change (el cambio en los bosques, que dentro de la web está en la columna de la izquierda). "Queremos saber cómo está cambiando el bosque y eso viene explicado ahí. El resto de las capas (biodiversidad, masa forestal, zonas intactas o protegidas) ayudan al análisis".

Haciendo zoom, activando y desactivando capas de datos, puedes encontrar historias de deforestación o reforestación. Además de los incendios gallegos o sojización, en este post hay otros nueve ejemplos para entender lo que pasa en los bosques del mundo.

Rompiendo la barrera entre la ciencia y las personas

Más allá del ‘wow, qué mapa tan vistoso’, la herramienta es útil para muchos agentes. "Sirve para diferentes tipos de personas que quieran trabajar con los datos. Agencias gubernamentales, o no, que quieran controlar la deforestación, grupos indígenas que quieran saber qué está pasando con su tierra o empresas que quieren asegurarse de que su cadena de distribución cumple con los compromisos", precisa Matallín.

"Digamos Unilever o Nestlé, que son empresas que han dado su nombre. Nestlé tiene proveedores que están explotando un área. Ellos pueden ir a esa zona, hacer un análisis y confirmar que lo que les han dicho sus proveedores coincide con lo que ellos ven a través de la web".

Y más allá de gobiernos, empresas y grandes organizaciones, el objetivo de Global Forest Watch es llegar a la gente: con la posibilidad de enviar historias para explicar, con fotos, palabras y ejemplos, qué pasa en los bosques del mundo (¿hay un incendio en Valencia?, ¿en la isla de Sumatra? Envíaselo para que aparezca sobre el mapa) y que cualquier ciudadano lo explore.

"Con los datos en números no haces nada. Con esto acercas un poco más, o ayudas a romper la barrera que hay entre la ciencia y las personas. Que, al fin y al cabo, es lo importante y realmente crucial de este proyecto".

ORIGINAL: El Diario (España)
Analía Plaza
02/03/2014

viernes, 7 de febrero de 2014

Limits of Capacity for the Exchange of Information in the Human Nervous System

ORIGINAL: Fractal - Elkin Echeverri


 Elkin Echeverri, IEEE Member

Limits of Capacity for the Exchange of Information in the Human Nervous System
An approximation to the maximum capacity of exchange of information in the central nervous system of the human body is carried out. The maximum possible quantity in bits per second that the brain possibly exchanges with the rest of the body is sought for. This value could be useful for the designing of bionic systems, the analysis of the operation of the brain and consciousness, as well as the designing of future communication systems

Date of Publication: Oct. 2006
Page(s): 803 - 808
ISSN : 1089-7771
INSPEC Accession Number: 9115121
Digital Object Identifier : 10.1109/TITB.2006.879585
Date of Current Version : 09 October 2006
Issue Date : Oct. 2006
Sponsored by : IEEE Computer Society [Technical Co-Sponsor]


martes, 4 de febrero de 2014

Secrets of the Brain. How the human mind really works.

Photograph by Robert Clark; brain preparation performed at Allen Institute for Brain Science
Centuries of study have provided increasingly detailed understanding of human brain anatomy.

Mind Machine. Photograph by Robert Clark

An engineer wears a helmet of sensors at the Martinos Center for Biomedical Imaging—part of a brain scanner requiring almost as much power as a nuclear submarine. Antennas pick up signals produced when the scanner’s magnetic field excites water molecules in the brain. Computers convert this data into brain maps like the one in the following image.


The Color of Thought. Image by Van Weeden and L. L. Wald, Martinos Center for Biomedical Imaging, Human Connectome Project

Scientists are turning their attention to the complex circuits that connect the brain’s many regions—some 100,000 miles of fibers called white matter, enough to circle the Earth four times. In this image taken at the Martinos Center, pink and orange bundles transmit signals critical for language.


Anatomy of a Mystery Image by Van Weeden and L. L. Wald, Martinos Center for Biomedical Imaging, Human Connectome Project

New technologies let scientists peer deep into the hidden structure of the brain. A high-resolution view of the image above reveals white matter fibers arranged in a mysterious grid structure, like longitude and latitude lines on a map.


The Glow of Memory Image by Garrett Gross and Don Arnold, University of Southern California

When you form a memory, “there’s a physical change in the brain, says Don Arnold, of the University of Southern California. Red and green dots on the branches extending from this rat neuron show where it contacts other neurons. As the rat forms new memories, new dots appear and old ones vanish.

Intimate View Photograph by Robert Clark Two hundred sections of a piece of mouse brain, each less than 1/1,000 the thickness of a human hair, are readied to be imaged by an electron microscope. Arranged in stacks, 10,000 such photomicrographs form a 3-D model no larger than a grain of salt (in tweezers).

Intimate View Image by Josh L. Morgan, Harvard University; Arthur Wetzel, Pittsburgh Supercomputing Center Arranged in stacks, 10,000 photomicrographs form a 3-D model no larger than a grain of salt. A human brain visualized at this level of detail would require an amount of data equal to all the written material in all the libraries of the world.


Jennifer on the Brain Caltech and UCLA scientists use pictures of celebrities to study how the brain processes what the eyes see. In 2005 they found an individual nerve cell that fired only when subjects were shown pictures of Jennifer Aniston. Another neuron responded only to pictures of Halle Berry—even when she was masked as Catwoman. Follow-up studies suggest that relatively few neurons are involved in representing any given person, place, or concept, making the brain staggeringly efficient at storing information.

TOP ROW (from left): Landov; Universal Pictures/Entertainment Pictures/Zuma Press; Kevin Dietsch, UPI/Landov; Universal Pictures/Entertainment Pictures/Zuma Press; Rune Hellestad, UPI/Landov; Tschiponnique Skupin, Future-Image/Zuma Press; Dan Steinberg, AP Images; Stephen Hird, Reuters; Ash Knotek, Snappers, Zuma Press; Lisa O'Connor, Zuma Press. SECOND ROW (from left): Franziska Krug, Action Press/Zuma Press; Sharkpixs/Zuma Press; D. Long, Globe Photos/Zuma Press; AJ Sokalner, UPPA/Zuma Press; Jordan Strauss, Invision/AP Images; Globe Photos/Zuma Press; Universal Pictures/Entertainment Pictures/Zuma Press; Universal Pictures/Entertainment Pictures/Zuma Press; ZBP/Zuma Press; Sharkpixs/Zuma Press; Henry McGee, Globe Photos/Zuma Press. THIRD ROW (from left): Fox Searchlight Pictures/Entertainment Pictures/Zuma Press; Clasos/Splash News/Corbis; Fox/Entertainment Pictures/Zuma Press; Graham Whitby Boot, Allstar/UPPA/Zuma Press; Paul Schmulbach, Globe Photos/Zuma Press; Ash Knotek, Snappers/ZUMA Press; Nancy Kaszerman, Zuma Press; NBC/NBCU Photo Bank/Getty Images; Paul Smith, Featureflash/Shutterstock. FOURTH ROW (from left): Kristin Callahan, Ace Pictures/Zuma Press; Globe Photos/Zuma Press; Lisa O'Connor, Zuma Press; EFE/Zuma Press; Mario Anzuoni, Reuters; Zuma Press; Jim Ruymen, UPI/Landov; Brian Kersey, UPI/Landov; Zuma Press; Jason Merritt, Getty Images. FIFTH ROW (from left): Graham Whitby, Globe Photos/Zuma Press; Morris Mac Matzen, AP Images; Chris Pizzello, AP Images; PA Photos/Landov; Globe Photos/Zuma Press; Nancy Kaszerman, Zuma Press; Mario Guzman, EFE/Zuma Press; Dave Longendyke, Globe Photos/Zuma Press. SIXTH ROW (from left): MWP/Zuma Press; Universal Pictures/Entertainment Pictures/Zuma Press; Paul Schmulbach, Globe Photos/Zuma Press; Nancy Kaszerman, Zuma Press; Landov; Columbia Pictures/Entertainment Pictures/Zuma Press; Armando Gallo, Retna Ltd./Corbis; Kristin Callahan, Ace Pictures/Zuma Press. SEVENTH ROW (from left): Chris Pizzello, AP Images; Kristin Callahan, Ace Pictures/Zuma Press; Dan Herrick, Zuma Press; Universal Studios/Entertainment Pictures/Zuma Press; Mario Anzuoni, Reuters; James Warren, UPPA/Zuma Press; Fox/Entertainment Pictures/Zuma Press; Danny Moloshok, AP Images; Nancy Rivera, Ace Pictures/Zuma Press


ORIGINAL: NatGeo

viernes, 24 de enero de 2014

Older Brains Know More and Use it Better as We Age

As we age, our brains go into a steady decline--at least according to previous research. Now, though, scientists have found that this isn't the case. Instead, the human brain works slower in old age because we have more stored information over time. (Photo : Flickr/DJ)

As we age, our brains go into a steady decline--at least according to previous research. Now, though, scientists have found that this isn't the case. Instead, the human brain works slower in old age because we have more stored information over time. The findings reveal a bit more about the human brain and the impacts of aging.

In order to learn a bit more why age affects the way we think, the researchers trained computers to read a certain amount each day and to learn new things. When the scientists allowed a computer to "read" only so much, its performance on cognitive tests resembled that of a young adult. Yet if the same computer was exposed to the experiences we might encounter over a lifetime, its performance looked like that of an older adult.

Yet the "older" computer wasn't slower because of its processing capacity. Instead, its increased "experience" caused the computer's database to grow and gave it more data to process. Needless to say, this processing took more time.

"Imagine someone who knows two people's birthdays and can recall them almost perfectly," said Michael Ramscar, one of the researchers, in a news release. "Would you really want to say that person has a better memory than a person who knows the birthdays of 2,000 people, but can 'only' match the right person to the right birthday nine times out of ten?"

The findings reveal that studies of the problems that older people have when it comes to recalling names may suffer from an unusual blind spot; there is a far greater variety that older people have to "sort" through, which makes recollection slower.

"Forget about forgetting," said Peter Hendrix, one of the researchers, in a news release. "If I wanted to get the computer to look like an older adult, I had to keep all the words it learned in memory and let them compete for attention."

The findings are published in the journal Topics in Cognitive Science.

ORIGINAL: Science World Report
Catherine Griffin
Jan 20, 2014

domingo, 5 de enero de 2014

Entrevista en la que Isaac Asimov describía la influencia de las computadoras en la educación

Hace 94 años Isaac Asimov nació en la villa de Petrovichi, a 400 kilómetros de Moscú. Aunque la fecha exacta no se conoce debido a la ausencia de registros y las confusiones a que se prestaban las conversiones del calendario judío al juliano (y luego al gregoriano), se estima que el escritor de la saga de Fundación pudo haber nacido cualquier día entre el 4 de octubre de 1919 hasta el 2 de enero de 1920. En todo caso, recordamos a Asimov el día en que el celebraba su cumpleaños, el 2 de enero.
Emigrado a Estados Unidos a los 3 años, Asimov creció leyendo revistas de ciencia ficción. A partir de los 19 años comenzó a escribir novelas y relatos cortos de ciencia ficción a la par que cursaba sus estudios de bioquímica en el Universidad de Columbia.

Entre sus obras más populares figuran la saga de Fundación (1942), que visualiza un futuro en el que la humanidad, a pesar de haber conquistado el espacio, está condenada al cáos, y su conjunto de historias sobre robots, reunidas bajo el título de Yo, Robot (1950).

Aquí presentamos un vídeo de una entrevista que le realizaron en 1988, cuatro años antes de su muerte, en la que Asimov habla sobre el impacto que las computadoras tendrán en la educación.


ORIGINAL: ProDaVinci
Por Prodavinci
2 de Enero, 2014
 

jueves, 7 de febrero de 2013

MIT Builds An Open-Source Platform For Your Body

ORIGINAL: FastCo
FEBRUARY 5, 2013


About This Series

Meet the people and discover the personalities driving the world's most radical, disruptive, and creative companies.READ MORE
MIT Media Lab's 11-day health care hackathon pulled students and big companies together with a common goal: Healing a broken industry.

Hack Thyself. The goal of the annual MIT Health and Wellness Hackathon is to jump-start an open source platform where apps that track all different aspects of your bodily health can exchange information. Here are this year's projects from the MIT Media Lab's 11-day event.
Siberian temperatures. Eleven grueling days, navigating rough terrain. Six teams, matched for talent, competing for glory at the end. The Iditarod? Nah, just the annual MIT Health and Wellness Hackathon.

This isn’t your average social app-fest. The goal is to jump-start an open source platform where apps that track all different aspects of your bodily health can exchange information. It’s a Sisyphean task, since most digital health solutions today are trapped in silos, but the organizers believe they can change that by enfranchising big companies instead of trying to disrupt them.

Healing The Health Industry
The tradition in health care technology is, ‘This is our device, we make our own software,’” says Dr. John Moore, who organized the hackathon. “The goal is to connect that bit of knowledge to the rest of your health experience. Just keeping track of your step count, for example, won’t let you change the rest of your life.”"JUST KEEPING TRACK OF YOUR STEP COUNT, FOR EXAMPLE, WON’T LET YOU CHANGE THE REST OF YOUR LIFE.

To unify the segmented market for health technology takes heavy lifting on the engineering side, since much of the progress made by private companies hasn’t been shared back to the community. Here, each team is required to use open source and open standard tools so that things work together seamlessly: specifically, the Lab's patient-centered CollaboRhythm platform and the Indivo X system for personalized health records.

Working from a common platform takes an extra effort to build,” Moore says, “but it ensures that the prototype will be something that has legs.” With Boomers aging and a lack of innovation coming from industry, the upside for these projects could be huge--but undertaking them is intimidating. “We thought we’d have to reject people,” says Moore, “but instead we just scared them off.

Hacking Together Industry Partnerships
The teams encamped on the Media Lab’s sixth floor, overlooking a Charles River initially frozen so solid you could stroll over to the Back Bay for pizza. This is the fourth such hackathon sponsored by the Lab’s New Media Medicine research group; when it started, the competition was 20 mostly MIT students who spent their winter break experimenting with open source innovation platforms for health care. Now the group includes an international assembly of professors, doctors, graduate and undergraduate students, as well as engineers from MIT sponsor companies like MIT sponsor companies like ViiV, Humana, Motorola and Fleury. Still, it’s only a start.

The hackathon itself is not enough to produce change, but it's an opportunity to expose important players in the ecosystem--pharma, insurers, medical diagnostics companies, startup entrepreneurs, consumer electronics companies--to the value of using and contributing to these platforms,” says Moore. “It’s rare to get these players to converge, but these 80 people are influencers, and now they know each other so they can collaborate. Big innovations will come when they all see how they can benefit each other.”

Matched into six project teams before arriving in Cambridge, the groups come at problems from different interests and areas of expertise, then work to create solutions that are more than just one-off apps or devices.

It would take years for all of these sectors to realize the potential that they have seen unfolding in the two weeks of this event,” says Moore. “It is this seed that may lead them to build their products differently and encourage that to collaborate with partners from other sectors using the same tools.

How Do You Incentivize Product-Ready Hacks?
The focus here is on producing commercially viable products. “Suddenly, you [can] have a really well-rounded tool that can be at the level of sophistication where you can get funding for a startup or a research grant,” says Moore. "We make sure the business people are supportive, and not just looking at today's business models.... We squash negativity. That's a big problem in the health space, where innovative ideas are often killed with comments like, 'Nah, nobody will ever get paid for that.' I act as the benevolent dictator to enforce that.""WE SQUASH NEGATIVITY. THAT'S A BIG PROBLEM IN THE HEALTH SPACE."

At the Health and Wellness hackathon, the winners aren't rewarded with cash since winning is only the beginning. Kaiser Permanente donated $15,000 to support the teams during development, instead of forcing them to go out-of-pocket to build their hacks. Awarding money to participants helps unshackle some of the crazier ideas; because current medical systems are plagued with legacy software, Moore wants participants to think blue-sky without being too constrained by cost. “We’re looking for optimal solutions,” Moore says, “more 'greenfield' kind of ideas." (Read on for examples from this year's projects.)

The Lab also provides on-site mentors in the form of software developers, professional UI designers, and video teams to bring projects to fruition. A team member with business experience is attached to each group, but is forbidden from dismissing good ideas that may be promising, but don't have a traditional revenue stream.

By the end of the marathon event, the Charles had thawed, and signs of encouragement were everywhere inside as well, says Frank Moss, a health care entrepreneur and former MIT Media Lab director. Driven by demands from patients and clinicians, he says everyone from the White House to the business community is “saying things we were saying four years ago,” around the time of the inaugural Health and Wellness hackathon. Here’s wishing the industry a speedy recovery.

The Projects
Last year’s Health and Wellness Hackathon winners, dubbed the Chameleon team, went on to launch a company called GeckoCap which produces a device for tracking asthma inhaler usage. The company, which was named “One of the Best Gadgets of CES 2013,” is currently raising funds on Indiegogo

Here are some of this year’s entrants.

hiVIVA

Adherence to medications is the key to keeping HIV/AIDS patients healthy, but compliance can be a problem. This app uses gaming to encourage users to take their pills. Users begin by uploading a photo they love to the home screen on their cellphone. Each morning, that image starts out fuzzy; the goal of the game is to sharpen it over the course of the day, based on adherence to the patient’s medication schedule. The system also gives patients a “virtual pill box” containing images of the actual pills in their regimen, to avoid confusion. Data is simultaneously sent to the patient’s physician via Bluetooth, and an accompanying device will eventually allow a patient to easily test his own blood. A prototype is currently being tested in Bangladesh.

Beacon
The Congestive Heart Failure team built a monitoring device called Beacon that would allow elderly patients with chronic conditions to stay in their homes longer. The device sits in a bedroom and is linked wirelessly to sensors throughout the house. If the sensor determines that the patient is moving less than normal, a light on the top of the main unit will turn yellow--alerting the patient to take her blood pressure, or step on a scale. Sudden weight gain, for example, is a sign that the patient’s condition is worsening. Data will be transmitted to the patient’s doctor, who can then communicate with the patient to see if a change in medications is called for, or if more serious intervention is required.

My Op
This app is designed to help patients who are about to undergo surgery for endometriosis learn about what to expect beforehand without scaring themselves by searching Google for information. Post-operatively, the app helps doctors assess how their recovery is going. The biggest problem, developers say, is that patients with this condition are so accustomed to being in pain that they often don’t recognize the severity of their symptoms after surgery, and thus fail to report them to their physicians until they’ve become acute. The My Op app allows doctors to monitor self-reported symptoms, and either text or have a video chat with patients if symptoms are concerning before they worsen.

The Brady Glove (left), The Tremo Cup (right)
AEON Health’s Parkinson’s disease devices
This group built a web-based platform to assess and manage Parkinson’s symptoms at home, allowing a patient to better control his own condition.

The Tremo Cup, which the patient uses to take medications several times a day, detects tremors, which correlate to how well a medication is controlling symptoms. By monitoring data, doctors can assess how long a medication is working, and if the timing or dose needs to be adjusted. It also allows a patient to see if he can influence the efficacy of the medication by adjusting exercise, food, or sleep.

The Brady Glove has sensors in each finger that allow a doctor to detect Bradykinesia–-the slowness of movement that is a prime indicator of Parkinson’s disease. Neurologists can assess the severity of a patient’s symptoms by asking him to tap his fingers, open and close his fist, and alter the position of his palm--the classic tests for Parkinson’s--then adjust his meds to help control symptoms.

Pressure Free
This team’s goal was to find a way for a patient to track and lower her blood pressure with minimal involvement by a physician. The solution was an app with three integrated devices: 

  • a blood pressure cuff that sends data to a dashboard; 
  • a Fitbit to measure how much the patient moves; and 
  • a container that monitors how many pills are still in the bottle
Forget to take your meds, and the 3-G powered pill bottle will send you a text message reminder without having to sync your device. In addition, the app will allow patients to invite friends to act as motivators, sending messages and videos to encourage compliance. The pill bottle, designed by a company called Adhere Tech, is already in development. 

Epicenter
The Epicenter team tackled the problem of controlling epileptic seizures through diet and biofeedback. The Ketogenic Diet app allows patients to track what they eat, measure the ketones they produce, and report side effects to doctors. A Ketogenic diet--high in fat and proteins, low in carbs--has been shown to be effective in controlling seizures, but is tough to follow. This app builds in recipes and meal suggestions, and encourages compliance by giving the patient a visual record of her progress.
Epilepsy app (left), epilepsy cap and wrist senor (right)

Epicenter also created a seizure tracking tool, where the patient can record seizure triggers, log how long the seizure lasted, and document feelings afterward. The patient’s doctor can analyze the data and intervene where necessary, and a gaming device using a neurofeedback cap that measures brain currents and a wrist sensor that measures galvanic skin response allows patients to influence their condition via biofeedback.

miércoles, 19 de septiembre de 2012

The Video Monsanto Does NOT Want You to See! Brought to you by Nutiva and Elevate

ORIGINAL: The GIC

What is a GMO, and how do GMOs effect you and your family?

The same corporations that said DDT and Agent Orange were safe have now put millions of dollars into the campaign against our right to know what's in our food. In November, Californians will vote on the most important issue to ever effect our food supply. As Goes California, So Goes the Nation.

Vote YES ON 37 Because We Have The Right To Know What's In Our Food!

Learn more about this important ballot initiative, and the future of your food supply here: http://www.carighttoknow.org/donate

lunes, 27 de agosto de 2012

Botanists building ontologies to cope with information overload

ORIGINAL: KurzweilAI
August 22, 2012

A few of the 20 to 100 million plant species in the world (credit: Eleassar/Wikimedia Commons)
Botanists are building ontologies such as the Plant Ontology (PO) to transform plant science by facilitating new ways of gathering and exploring data, Ramona Walls (New York Botanical Garden) and colleagues explain in an open-access article in the American Journal of Botany.

An ontology (in the information science meanng) is a description of the types of entities within a given domain and the relationships among them. When data from many divergent sources, such as data about some specific plant organ, are associated or “tagged” with particular terms from a single ontology or set of interrelated ontologies, the data become easier to find.

Computers can also use the logical relationships in the ontologies to correctly combine the information from the different databases and to aggregate data associated with the different subclasses or parts of entities.

For example, suppose a researcher is searching online for all examples of gene expression in a leaf. Any botanist performing this search would include experiments that described gene expression in petioles and midribs or in a frond.

However, a search engine would not know that it needs to include these terms in its search — unless it was told that a frond is a type of leaf, and that every petiole and every midrib are parts of some leaf. It is this information that ontologies provide.
Ontology showing how two leaf structures relate to “vascular leaf” (credit: Plant Ontology Consortium)
Four keys areas of plant science could benefit from the use of ontologies, the authors say: (1) comparative genetics, genomics, phenomics, and development; (2) taxonomy and systematics; (3) semantic applications; and (4) education.

REFERENCES:


Topics: Biotech | Computers/Infotech/UI | Environment/Climate

domingo, 5 de agosto de 2012

Meat the future

ORIGINAL: Meat The Future


Meat the future is a project that intends to inform people about todays unsustainable and inhumane meat industry. But also give hope for a change as there is a solution in sight, called In Vitro meat.

Please help us spread the word!

If you would like to get in touch with us, please send an email to contact@meatthefuture.org

This is a project by Afshin Moeini, Christian Poppius and Kim Brundin from Beckmans College of Design.

El brote de ébola ¿podría llegar a Estados Unidos y otros países?

ORIGINAL: CNN
4 agosto 2012


(CNN) — Al menos 16 personas han muerto hasta ahora por el brote de ébola que inició a principios de julio en el occidente de Uganda. Según la Organización Mundial de la Salud (OMS), se cree que el primer caso vino de la villa Nyanswiga en Nyamarunda, un subcondado del distrito Kibaale, de Uganda.

Nueve de las muertes, según reportes, ocurrieron en una misma casa y un funcionario de salud que trataba a uno de esos pacientes también murió.

La OMS dijo este viernes que el brote está controlado en ese país, donde más de 50 personas han sido diagnosticadas con el virus. Pero, ¿qué es el ébola y cuáles son las probabilidades de que se propague a otros continentes?

Cuándo fue descubierto el ébola

El virus de ébola fue detectado por primera vez en 1976 en Zaire, una nación de África central que ahora se llama República Democrática del Congo. El virus fue nombrado como un río en ese país, a cuya orilla se encontró el primer brote de la enfermedad. Hay cinco especies de virus de ébola, todos nombrados con base en las áreas donde fueron encontrados en: Zaire, Sudán, Costa de Marfil, Bundibugyo y Reston, según la OMS. (Cada especie de ébola puede tener diferentes cepas).

Los funcionarios de salud han determinado que la especie de Sudán es el culpable de este brote actual, que está entre las tres especies más letales de ébola. Las tasas de mortalidad de los brotes de fiebre hemorrágica de ébola en África están entre el 25% y el 90%, de acuerdo con una hoja informativa de la OMS.

Hasta ahora se ha encontrado que la especie Reston de ébola es la única que infecta a humanos y no causa enfermedades graves o muertes.

Síntomas y tratamiento del ébola

Los síntomas iniciales de ébola pueden ser confundidos con otras enfermedades (como la gripe) debido a que pueden ser muy similares:

  • fiebre alta repentina, 
  • dolor de músculos y articulaciones y 
  • dolor de garganta. 
Pero las víctimas de ébola a menudo tienen 
  • diarrea con sangre 
  • y/o comienzan a vomitar, 
  • seguido de erupciones, 
  • ojos rojos, y 
  • hemorragias internas y externas (sangrado en la nariz o encías).
Los primeros informes de este brote sugieren que más pacientes sufrieron de vómitos y diarrea que de hemorragias externas visibles, pero los funcionarios de salud advierten que la información sobre este brote sigue dispersa y la investigación acaba de empezar.

No hay tratamiento para el ébola ni vacuna. Todo lo que los médicos pueden hacer es proporcionar a los pacientes tratamiento de apoyo, como: reponer sus líquidos y electrolitos; mantener su presión arterial y niveles de oxígeno bajo control y tratar cualquier infección adicional, según los Centros para el Control y Prevención de Enfermedades de Estados Unidos (CDC, por sus siglas en inglés).

Hay mucho que no se conoce sobre esta enfermedad, pero los investigadores sospechan que “los pacientes que mueren normalmente no han desarrollado una respuesta inmune significativa al virus en el momento de su muerte”, según una hoja informativa de los centros.

¿Cómo se transmite?

Los investigadores no saben cuál es el reservorio natural del virus de ébola. Pero han encontrado a su virus primo: Marburgo, que también causa fiebre hemorrágica en murciélagos de la fruta en África.

Aunque no hay casos conocidos de un humano directamente infectado con el ébola por un murciélago hay dos casos documentados de humanos infectados con el virus Marburgo después de estar en una cueva llena de murciélagos de fruta.

Sin embargo, los investigadores creen que los humanos están infectados por manipular animales muertos o vivos que están infectados (como chimpancés, gorilas y antílopes), o por estar en contacto directo con alguien que está enfermo con el virus o ha muerto de ébola.

El virus puede ser encontrado en fluidos corporales (como sangre, orina, diarrea y saliva), así que el contacto directo con estos fluidos de animales o humanos infectados puede llevar a la transmisión. Las personas también pueden infectarse al estar en contacto con secreciones corporales encontradas en agujas, bisturís, ropa sucia y ropa de cama.

¿El ébola puede ser contenido?

Una vez que el brote ha sido identificado, la transmisión del virus puede ser prevenida, si se toman las precauciones adecuadas. Evitar contacto con fluidos corporales de alguien con ébola es clave. Eso significa vestir equipo de protección personal adecuado como guantes, batas, mascarillas y protección ocular. Los hospitales también deben instalar salas de cuarentena para aislar a los pacientes con ébola.

Los funcionarios dijeron a CNN que quienes cuidan de los enfermos necesitan llevar equipo de protección personal, pero alguien que sólo camina en una villa donde un paciente estuvo enfermo no necesita vestir una mascarilla, porque el virus no se propaga por el aire.

Este brote, ¿podría propagarse a otros continentes?

Los expertos dicen que es poco probable que el brote actual se propague a Norteamérica. El único ejemplo de transmisión de ébola en Norteamérica llegó a Estados Unidos con la importación de monos de investigación y ningún humano se enfermó.

Hace cuatro años dos turistas (una holandesa y un estadounidense) que viajaron a Uganda se infectaron con la fiebre hemorrágica de Marburgo. Ambos pacientes regresaron a sus países natales, según los CDC. El estadounidense sobrevivió y la holandesa murió, pero nadie más se infectó debido a que se tomaron protecciones adecuadas durante el tratamiento.

¿Cuándo se considera que un brote terminó?

El periodo de incubación del ébola es de dos a 21 días, según la OMS. Los funcionarios de salud dicen a CNN que un brote se considera como terminado después de dos periodos de incubación después de que la última persona se enfermó; un total de 42 días.