
ORIGINAL: FastCoexist

We wrote before about EcoHack, a event bringing together coders, designers, and hobbyists to work on environmental problems. Last November, the participants collaborated on everything from visualizing deforestation, to tracking sewage overflows in New York harbor. And many of the same faces were back for the most recent Ecohack, with a fresh set of projects, and a new focus on hardware hacking, to go alongside code and data.
The democratic idea of Ecohack is that participants pitch ideas they’re working on, asking the rest of the group for input and collaborative time; the ideas that seize the collective imagination get taken forward, while the rest are set aside for another time. Here are a few projects that were presented:
 AIRCASTING
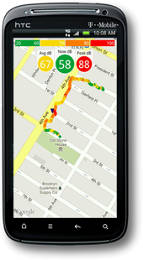
Michael Heimbinder talked about his AirCasting platform, which allows people to send in local noise-quality data from a cell phone, building up detailed maps of noise levels. He’s hoping to add pollution monitoring soon, and eventually all kinds of "bionsense" data. Heimbinder wants to improve understanding of the relationship between environmental and human health, and to take the conjecture out of people’s complaints about things like unsociable neighbors. As the site says: "When you share your AirCasting data with other AirCasters, your data and notes become a social statement, linking your experiences to the community’s observations."
AIR COLUMN MONITOR
Shannon Dosemagen, of the Public Laboratory for Open Technology and Science (PLOTS), is working on hardware. The Air Column Monitor is a "balloon-mounted air quality sensor" that helps communities understand what the local power plant is spewing out, or whether "CO2 domes" are building in the atmosphere. The project is closely related to the Air Quality Egg, which we featured here recently. The potential of such projects is huge: thousands of devices, all connected together, delivering real-time information, and much greater transparency.

 WHERE DID THE GORILLAS GO?
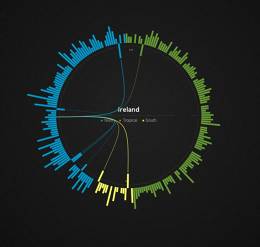
Craig Mills is looking at ways of analyzing and visualizing data on animal movements. The UNEP World Conservation Monitoring Centre, where Mills works, holds more than 12 million records from the last 50 years. Mills talked about international trade in gorilla feet, and how he wants to dig into the data to build up an historical timeline. The end-result is that you get nice-looking, and interactive, visualizations like this one.
TRACKING BIODIVERSITY
TRACKING BIODIVERSITY
Tim Robertson, a Brit, works for the Global Biodiversity Information Facility, an open-access repository of more than 300 million biodiversity records (including citizen-science observations, and natural history specimen inventories). Robertson spoke about the possibility of digitizing books, and then extracting species observations for further analysis. The video above, showing how the European sparrow "invaded" North America, is an example of the sort of visualization that becomes possible once you have data in a standardized, usable form.

No hay comentarios:
Publicar un comentario
Nota: solo los miembros de este blog pueden publicar comentarios.